Help Section
1. Publications in NCBI
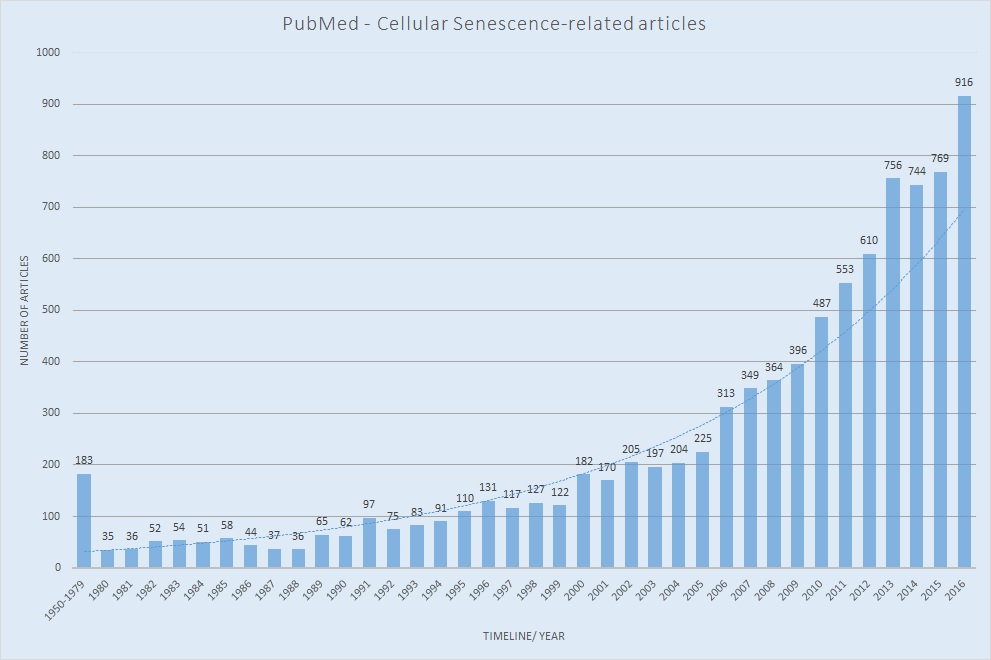
Here's searching result with key word "cellular senescence" in the PubMed.
NCBI PubMed:"cellular senescence"
2. Senescence-associated networks in HCSGD
We build two networks via integrating various data sources, including the gene pairs identified through the text-mining, the PPI network from the HPRD, and meta-analysis of gene expression profiling data from GEO database. The literature mining network is formed through an improved version of the text-mining part from LMMA(Li, Wu, & Zhang, 2006). This network is composed of gene/protein pairs co-occur with a key interaction word within one sentence(Hur, Ozgur, Xiang, & He, 2012). The PPI subnetwork is constructed by integrating the known cellular senescence genes, PPI network and the co-expression relationships between genes.
We also provide the information of genes targeted by compounds (ChEMBL), drugs (DrugBank) or microRNAs (miRTarBase and miRecords). In each network, the targeted state will be shown in the relevant network. If the gene is targeted by the relevant component, the node will be shown in yellow, while the rest genes are white in the relevant network.
The related links are as below:
ChEMBL (https://www.ebi.ac.uk/chembldb/)
DRUGBANK (http://www.drugbank.ca/)
miRecords (http://mirecords.biolead.org/)
miRTarBase (http://mirtarbase.mbc.nctu.edu.tw/)
In the network of differentially expressed states, the colors of the nodes changes from red to blue, which means that the genes is up-regulated in the senescent samples compared to the growing samples. The size of the node means the occurrence number of the genes in the text-mining results in the literature mining network, while the size of the node in the PPI subnetwork represents its degree in this network. In addition, the search function is provided. After searching a gene, the result will be shown in a table-view. The user could choose to jump to either of the network (the font of searching gene is becoming larger) or the gene page.
I. Literature-mining network
The literature-mining network is composed of the co-occurrence gene/protein pairs in the abstracts of senescence-associated articles. We downloaded more than 3000 cellular senescence-associated abstracts from the PubMed with entering the keywords "cellular senescence". Then we split each of them into sentences. We regard the gene/protein pairs co-occur with a interaction word in one sentence as the potential gene pairs (Hur et al., 2012). The pairs occur only once in the text-mining results are filtered out.
II. PPI subnetwork
The PPI subnetwork is constructed by integrating various data sources. The edges reflect the potential functional relationships between the candidate genes. First, the candidate genes are collected from the neighbours of the seed genes in the PPI network, while the seed genes are the ones with high-frequency in the text-mining results (whose occurrences is larger than 50). Then, these candidate genes are mapped to the PPI network to get the subnetwork. Finally, the association between each pair of nodes is filtered through the co-expression. The rank of the Average Fold Change in each data set are used to make the Spearman's Rank correlation, and we filter out the pairs whose p-value is larger than 0.05.
3. Search function in HCSGD
The search function enables the users to retrieve a single gene, a gene pair or a user-defined gene set.
You could search for the detail of the senescence-associated genes you are interested in. The searching result will be shown in a view of table. The users could choose to redirect to the network page or the gene page. On the searched network page, the label of the searching gene shows larger and bold, while on the gene page, some senescence-relevant information about this gene is provided, including the nearest neighbors in these two networks, the Gene Ontology information, the expression level of the gene from the meta-analysis, the target state information and the text-mining results. The query may be the entrez ID or the symbol gene name. For example, if you want to search the gene TP53, you could search "TP53" or its entrez ID "7157".
The function of searching the gene pair or gene set you are interested in is allowed. If the gene pairs present in either of our networks, the detail of the relationships between this gene pair will be shown on the gene pair page. For example, you want to retrieve the relationship between CDKN2A and TP53, you could search as below, this pair of genes with one edge only appear in the literature mining network, so you will redirect to the edge page between CDKN2A and TP53 in the literature mining network, on which the general gene information of these two genes and the information through the text-mining will be shown. Both the entrez ID and Symbols are allowed.
If you search a gene set, the associated subnetwork composed of the input genes and their neighbors is shown. Here, only the entrez ID is allowed. For example, if you want to search the gene set "CDKN2A , TP53 and CDKN1A", you could enter "1029;1026;7157", with the entrez id separated by semi-colon. The associated subnetwork will show.
4. Integrative meta-analysis of microarray data
Here, we make a meta-analysis of 15 cellular senescence-associated gene profiling datasets about human. These 15 datasets are from three different Affymetrix microarray platforms, namely, 133plus2, Exon1.0 ST and Human Gene 1.0 ST. In order to deal with the batch effect between different labs and different platforms, we select a rank-based statistic method.
For each set of expression data, the genes are ranked based on the fold changes of the cases and controls. Here, the cases mean the senescent cells (including the replicative senescence, oncogene-induced senescence, stress and other induction) while the controls mean the growing cells, also called the young cells. Then we make a meta-analysis of these rank via the method of rank statistic (Hong et al., 2006) to get the p-value of differential expression levels.
5. Gene page in HCSGD
I. The components of HCSGD are genes, you have three ways to retrieve genes.
a. The users could retrieve the genes through the interactive graphical interface. You could click the genes you are interested in.
b. The comprehensive search function is provided. After searching, the user could redirect the gene page.
c. The meta-analysis result is presented in a table view, from which the users could select the genes they are interested in.
II. We provide comprehensive gene annotations. For each gene, the annotations are as below.
a. The general gene information, including its official gene symbol, Entrez gene ID, the links to the GeneBank, etc.
b. The neighbors of the gene in each layer network.
c. We get the gene-associated GOs from the Gene Ontology database (http://www.geneontology.org/).
d. The Expression level of the genes of our processing results, including the meta-analysis result and the fold changes in the separate data set.
e. If the gene is targeted by the compounds, drugs or the microRNAs, the associated regulators will be provided in a table.
f. Text-mining results of the genes, including the number of the genes occurs in the abstracts and the relevant sentences the gene occurs in.
6. Edge page in HCSGD
Each edge in the network means that there may exist some relationships between these two nodes, and these two nodes are also called the potentially functional related gene/protein pair.
In this page, these two gene information is shown. If this gene/protein pair occurs in the literature-mining, we will provide associated pubmed ID of the articles and the interaction words co-occurring with. If this gene/protein pair occurs in the PPI subnetwork, the information of the edge in the HPRD database and p-value of the Spearman Rank Correlation between these two genes will be shown.
7. Result of searching Gene set in HCSGD
You could search the gene set you are interested in. And the gene names could be the Entrez ID only, separated by the ";", such as: 7107; 1029; 1026. The output is the subnetwork composed of the neighbors of the input gene set in either of our network.
8. JavaScript Technologies
I. D3.js JavaScript library
By Mike Bostock
We use the d3 force-directed layout to construct the Literature mining network and the PPI subnetwork and all their sub-graphs.
II. Sorttable: Make all your tables sortable
By Stuart Langridge
This is used to make some of our data tables sortable.
III. Simple Javascript Drop-Down Menu v2.0
By Kawsar Ali
This is used in our navigation bar in the top of every page (Home-Network-Search-Data-Download-Help).
Reference
1. Hong, F., Breitling, R., McEntee, C. W., Wittner, B. S., Nemhauser, J. L., & Chory, J. (2006). RankProd: a bioconductor package for detecting differentially expressed genes in meta-analysis. [Research Support, Non-U.S. Gov't Research Support, U.S. Gov't, Non-P.H.S.]. Bioinformatics, 22(22), 2825-2827. doi: 10.1093/bioinformatics/btl476
2. Hur, J., Ozgur, A., Xiang, Z., & He, Y. (2012). Identification of fever and vaccine-associated gene interaction networks using ontology-based literature mining. J Biomed Semantics, 3(1), 18. doi: 10.1186/2041-1480-3-18
3. Li, S., Wu, L., & Zhang, Z. (2006). Constructing biological networks through combined literature mining and microarray analysis: a LMMA approach. Bioinformatics, 22(17), 2143-2150. doi: 10.1093/bioinformatics/btl363

